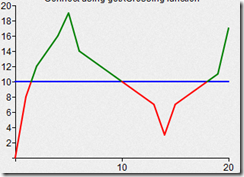
I frequently get asked how to create a chart in JavaScript that shows a different line color above and below the previous close price. Here is a example of what I mean.
View this test page if you want skip the details and see a working example in JavaScript/SVG
At first glance, I’ve always thought this would be very easy and instructed them to create a new path depending on if the line is above or below the previous close line (the blue line in the image above). Simple enough right?
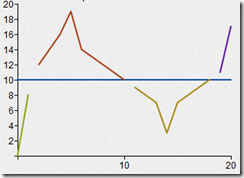
It turns out I was missing a crucial step that might go unnoticed if you are using many data points. The problem turns up when using sparse data like the example shown above.
Here is what it looks like if you do what I said literally.
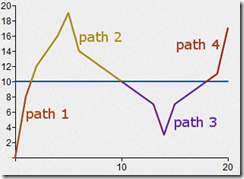
That missing step I mentioned is connecting the new lines. Seems obvious now that I look at an example. So how will this be done? Here is an image showing the paths with labels for easy reference.
What I have found works best is to find the intersection point between the paths and the previous close line. So you would create one line using the last point from path 1 and the first points from path2. The second line would just be the previous close line points. Unfortunately, just having the points is not enough to calculate the intersection.
Below is the needed format and calculation. I created a function to do this in JS which is provided below but I wanted to include the full explanation.
Say we are given two different points, (x1, y1) and (x2, y2), and want to find A, B and C for the equation above. We can do so by setting
A = y2-y1
B = x1-x2
C = A*x1+B*y1Regardless of how the lines are specified, you should be able to generate two different points along the line, and then generate A, B and C. Now, lets say that you have lines, given by the equations:
A1x + B1y = C1
A2x + B2y = C2To find the point at which the two lines intersect, we simply need to solve the two equations for the two unknowns, x and y.
double det = A1*B2 – A2*B1
if(det == 0){
//Lines are parallel
}else{
double x = (B2*C1 – B1*C2)/det
double y = (A1*C2 – A2*C1)/det
}
Here is the full function in JS to create this format and find the intersection.
  //Line-Line Intersection
        var getXCrossing = function(p1x, p1y, p2x, p2y, marker, markerMaxX) {

                var retValX = 0;
                var retValY = 0;

                //graph lines
                var a1 = p2y - p1y;
                var b1 = p1x - p2x;
                var c1 = a1 * p1x + b1 * p1y;

                //marker line is always horizontal
                var a2 = marker - marker;
                var b2 = 0 - markerMaxX;
                var c2 = a2 * 0 + b2 * marker;

                var det = a1 * b2 - a2 * b1;

                if(det === 0)
                {
                    //Lines are parallel
                }
                else
                {
                    retValX = (b2 * c1 - b1 * c2) / det;
                    retValY = (a1 * c2 - a2 * c1) / det;
                }

                return {
                        x: retValX,
                        y: retValY
                    };
                };
Here is a test page which shows a working example in SVG using gRaphaël JavaScript library.


Leave a Reply